June 2022 layers: ZIP codes, congressional districts & more
Our Data Team is working hard to bring you useful (and beautiful) data layers.
Our Data Team is working hard to bring you useful and beautiful data layers.
These data layers are often requested by users to unlock a use cases or end a painful existing workflow. Often we hear from folks who are fed up tabbing between two mapping websites to get their job done and would rather just see it all in one place. If that’s you, send us a data layer request. We sort through these requests and determine what we should curate, and our cartographer designs the look and feel. Then we get busy shipping.
Our team brought ten new data layers into Felt in June:
- Bureau of Land Management Trails & Campgrounds
- US Drought Monitor for June 2022
- Graticule
- Drought Risk
- Lighthouses
- Congressional Districts
- Senate Districts
- State House Districts
- Libraries
- ZIP Codes
Click the images and duplicate the map to get started with a data layer of your choice.
Bureau of Land Management Trails & Campgrounds
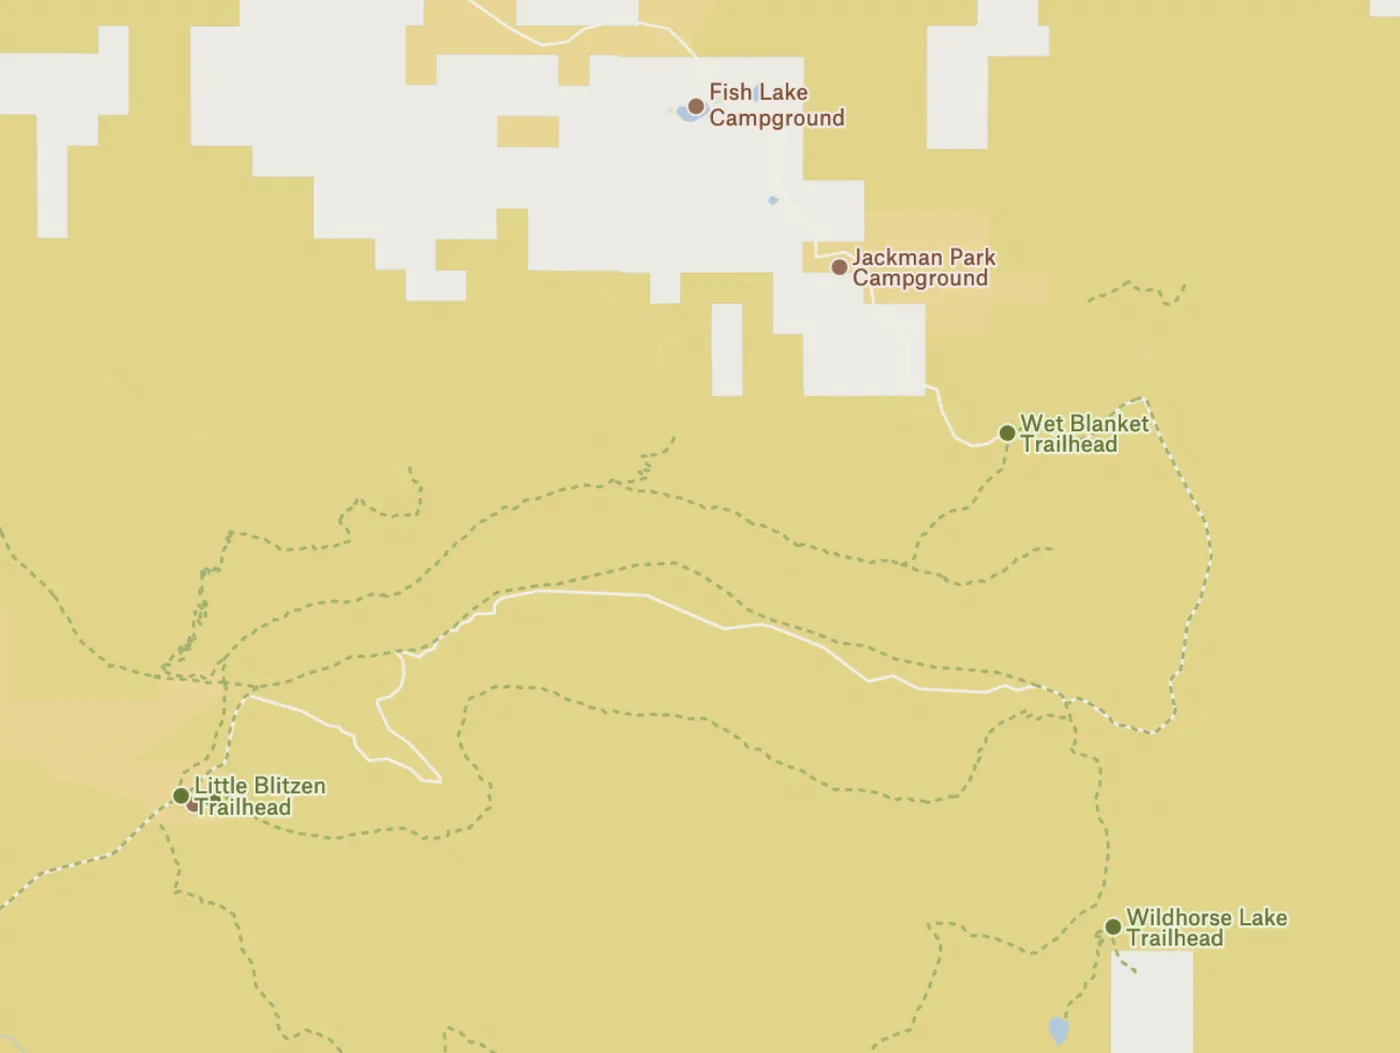
Bureau of Land Management Trails and Campsites - Now when you add the the public lands and resources managed by the US Bureau of Land Management (BLM), you will see trails, trailheads and campsites.
US Drought Monitor for June 2022
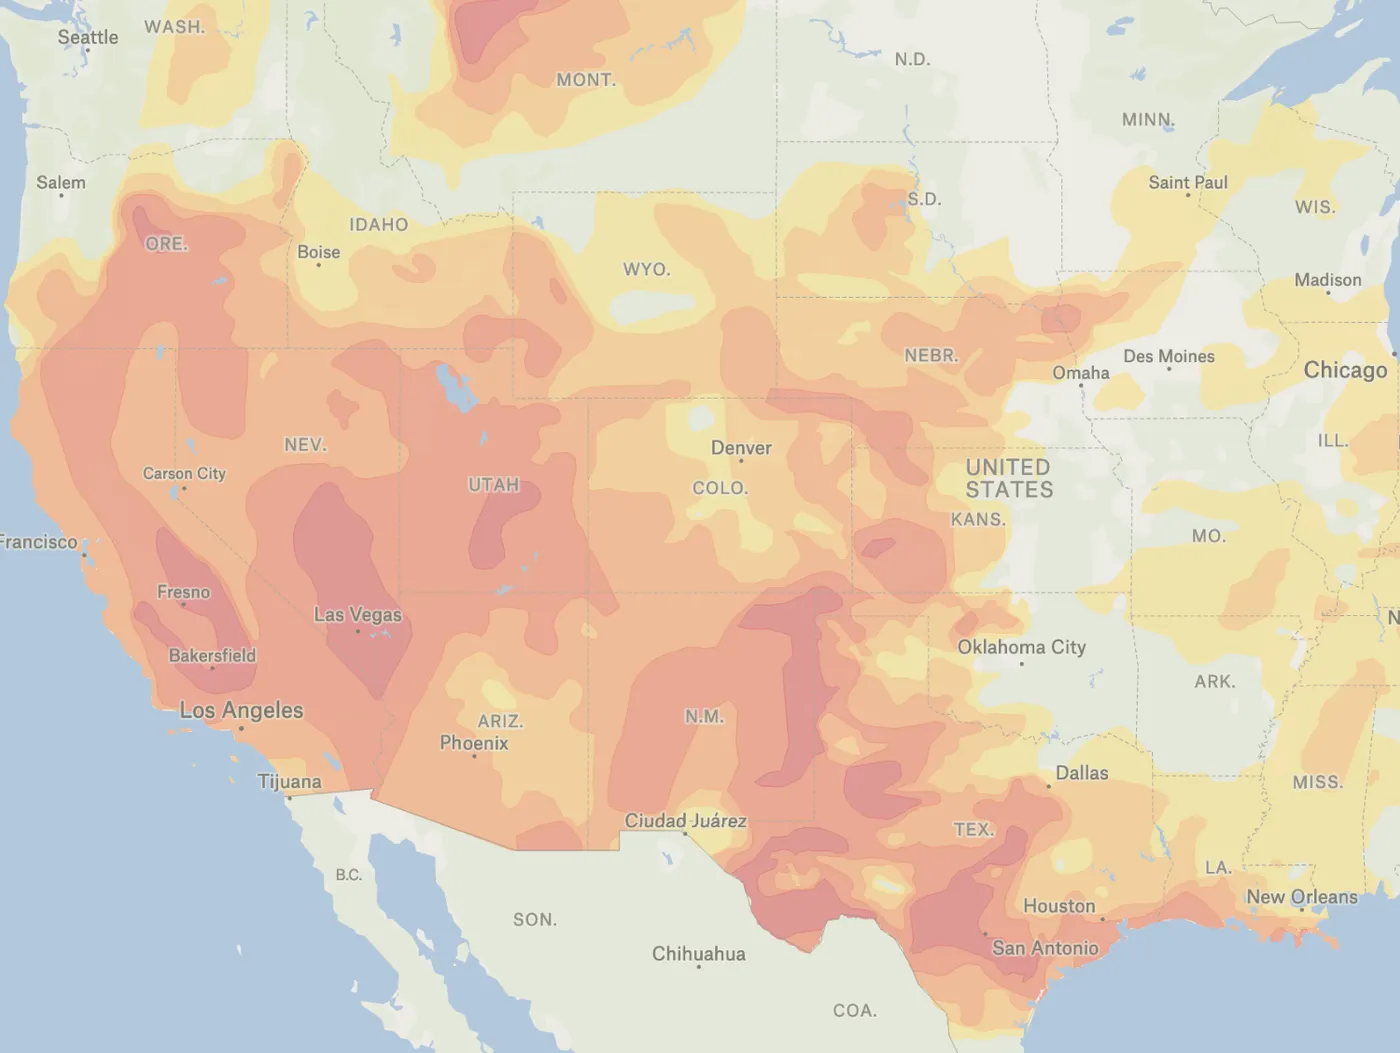
US Drought Monitor - June 2022- this drought layer is published monthly and, when paired with layers from previous months, you can begin to see the ebb and flow (mostly flow) of drought conditions across the United States. Check it out.
Graticule
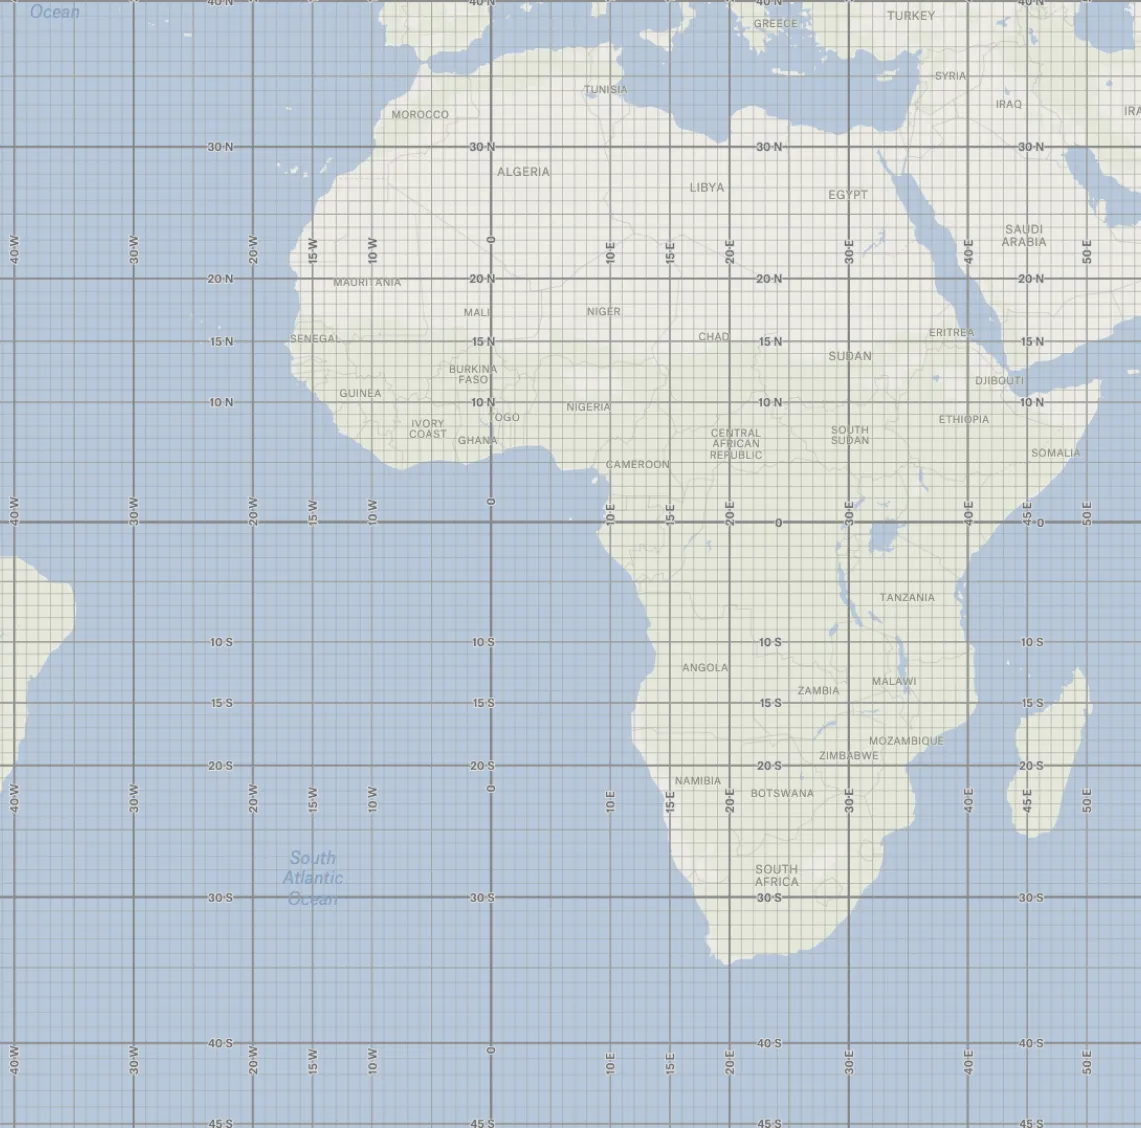
Graticule - Graticule is a network of lines representing meridians and parallels, on which a map or plan can be represented. We’ve added the latitude/longitude grid at 1, 5, 10, 15, 20 and 30º intervals using Natural Earth as our source.
Drought Risk
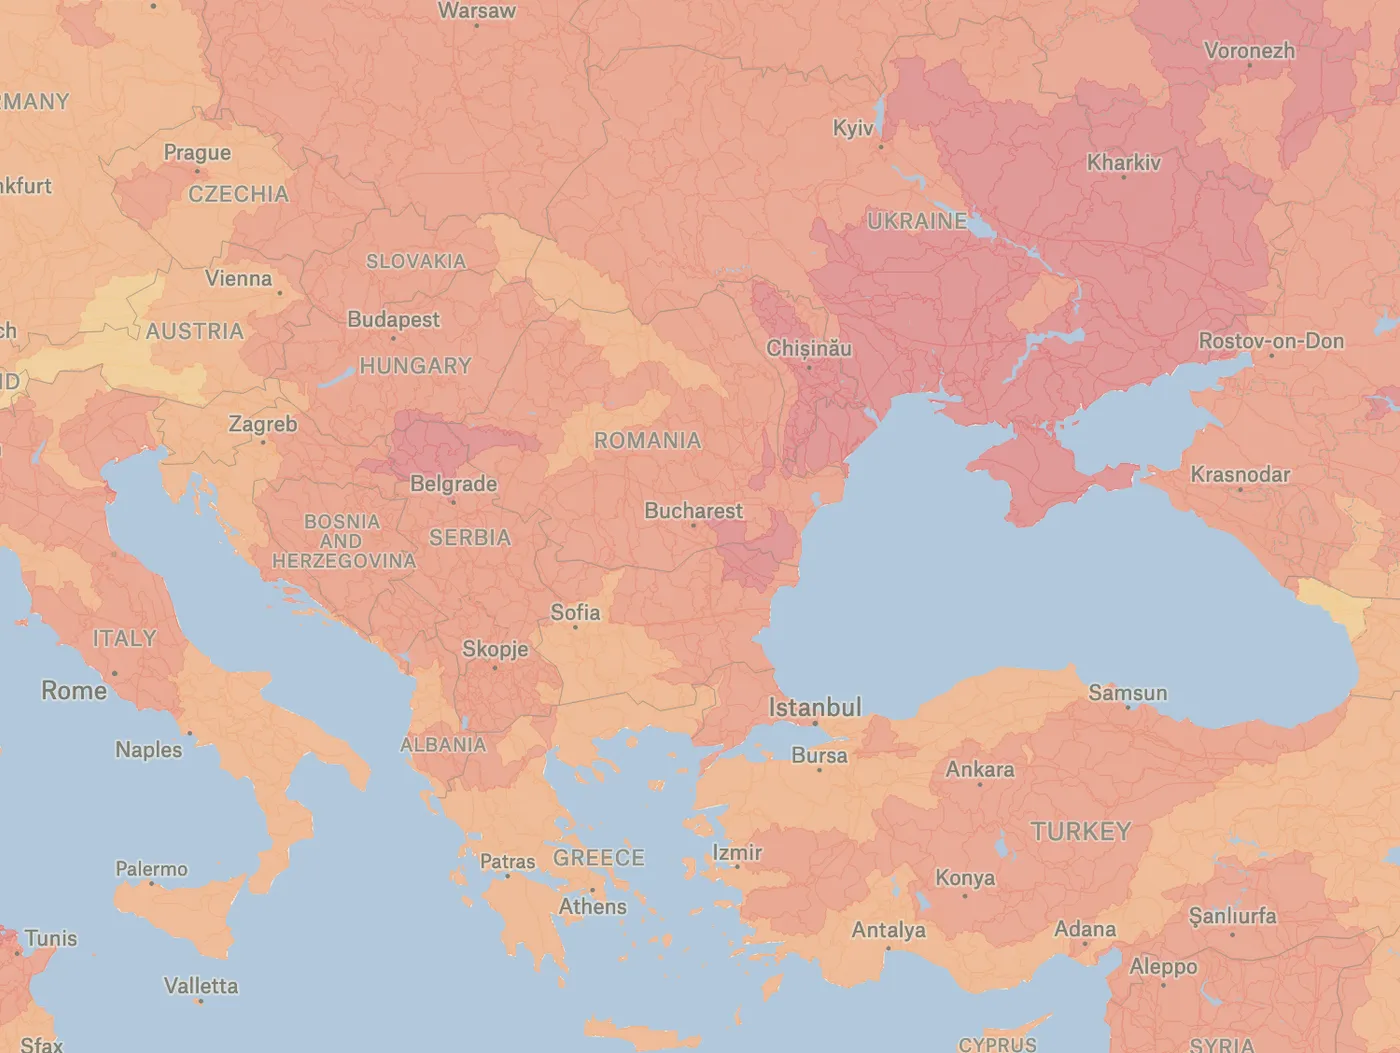
Drought Risk (Global, Aqueduct Water Risk Indicators) - Get a more global view of drought conditions with this drought risk layer from World Resources Institute. The drought risk layer measures where droughts are likely to occur, the population and assets exposed, and the vulnerability of the population and assets to adverse effects. Higher values indicate higher risk of drought.
Lighthouses
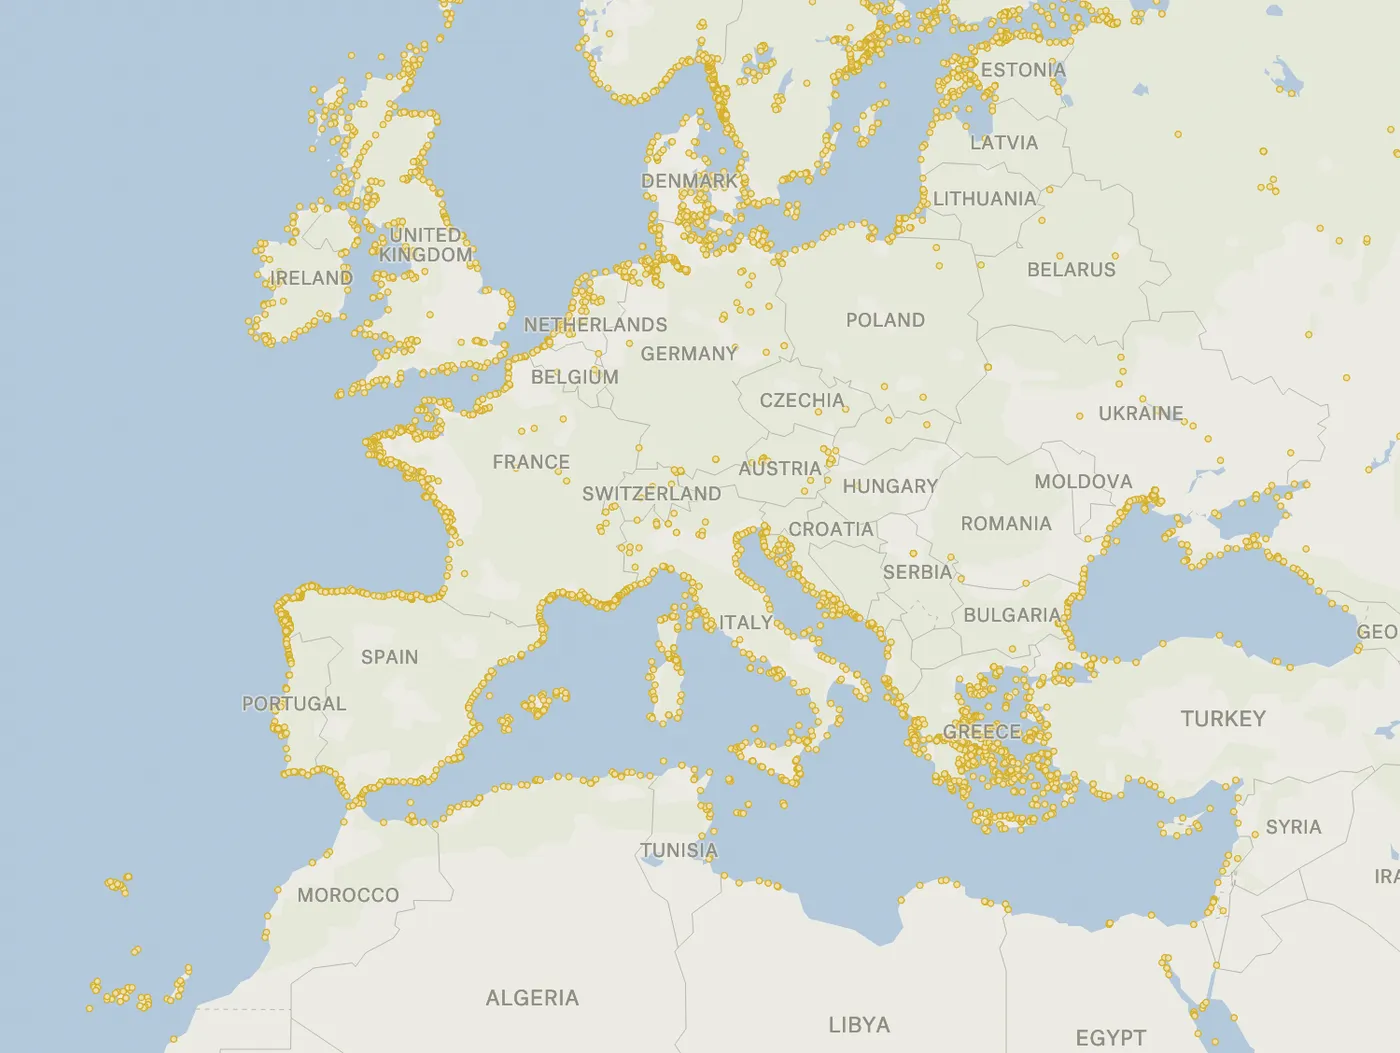
Lighthouses - Did you have any idea how many lighthouses speckle the planet’s shorelines? Check out our lighthouses layer from OpenStreetMap.
Congressional Districts
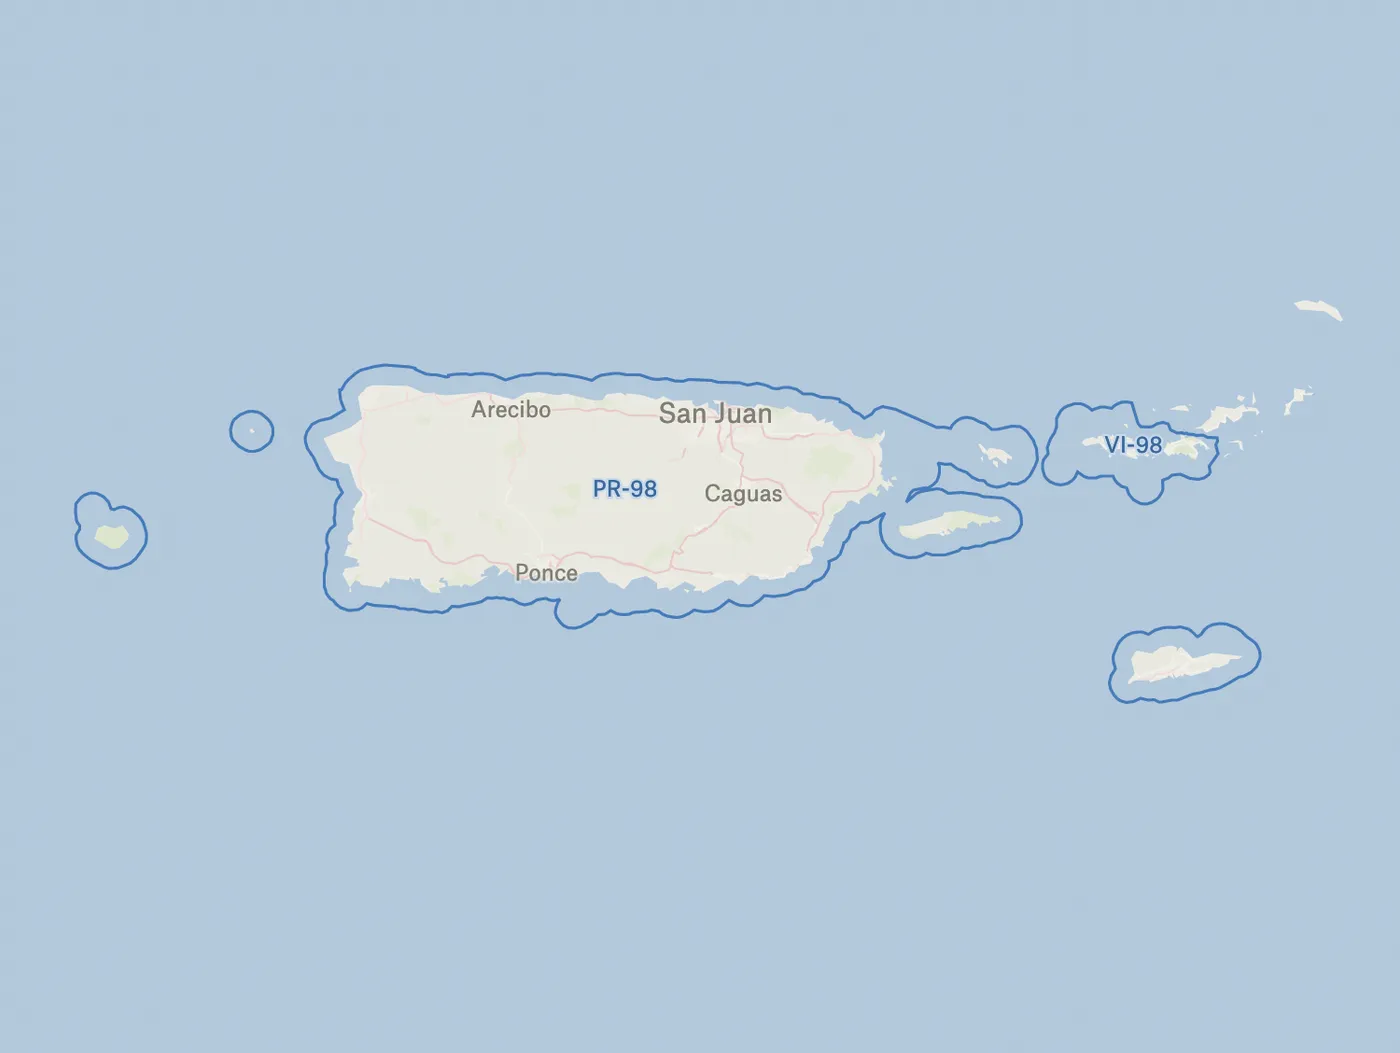
Congressional Districts - By request! Congressional Districts are the 435 areas from which people elect their voting delegates to the U.S. House of Representatives and the 5 areas with nonvoting delegates from state equivalents (District of Columbia, Puerto Rico, American Samoa, Guam, and U.S. Virgin Islands).
State Senate Districts
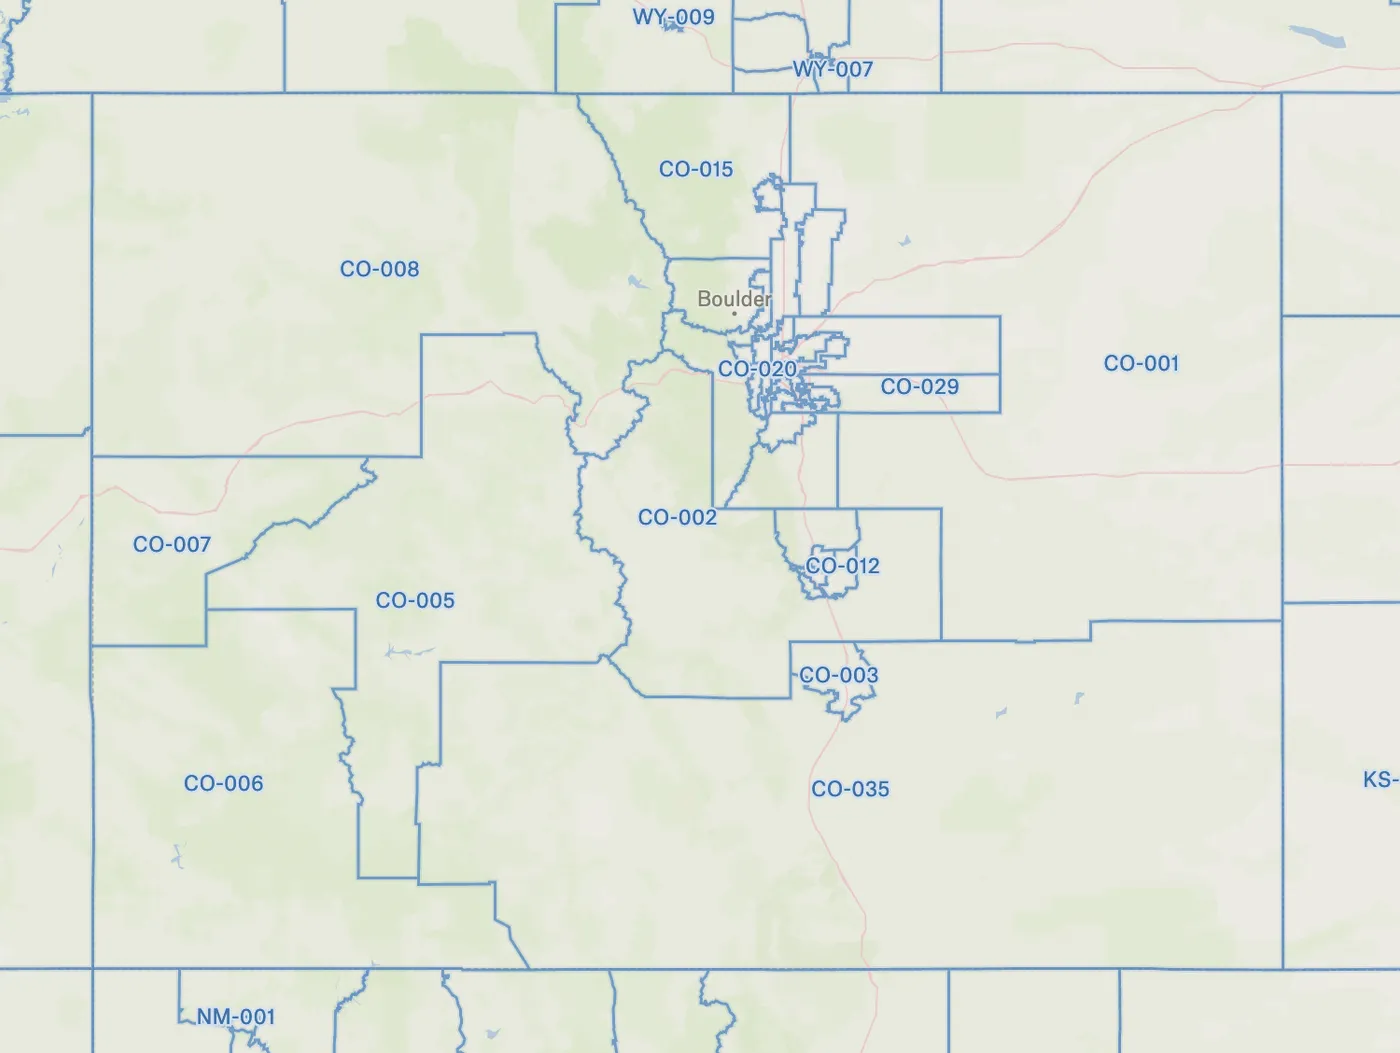
State Senate Districts - Check out your State Senate Districts. These State Legislative Districts (SLDs) are the areas in which voters elect a person to represent them in state or equivalent entity legislatures.
State House Districts
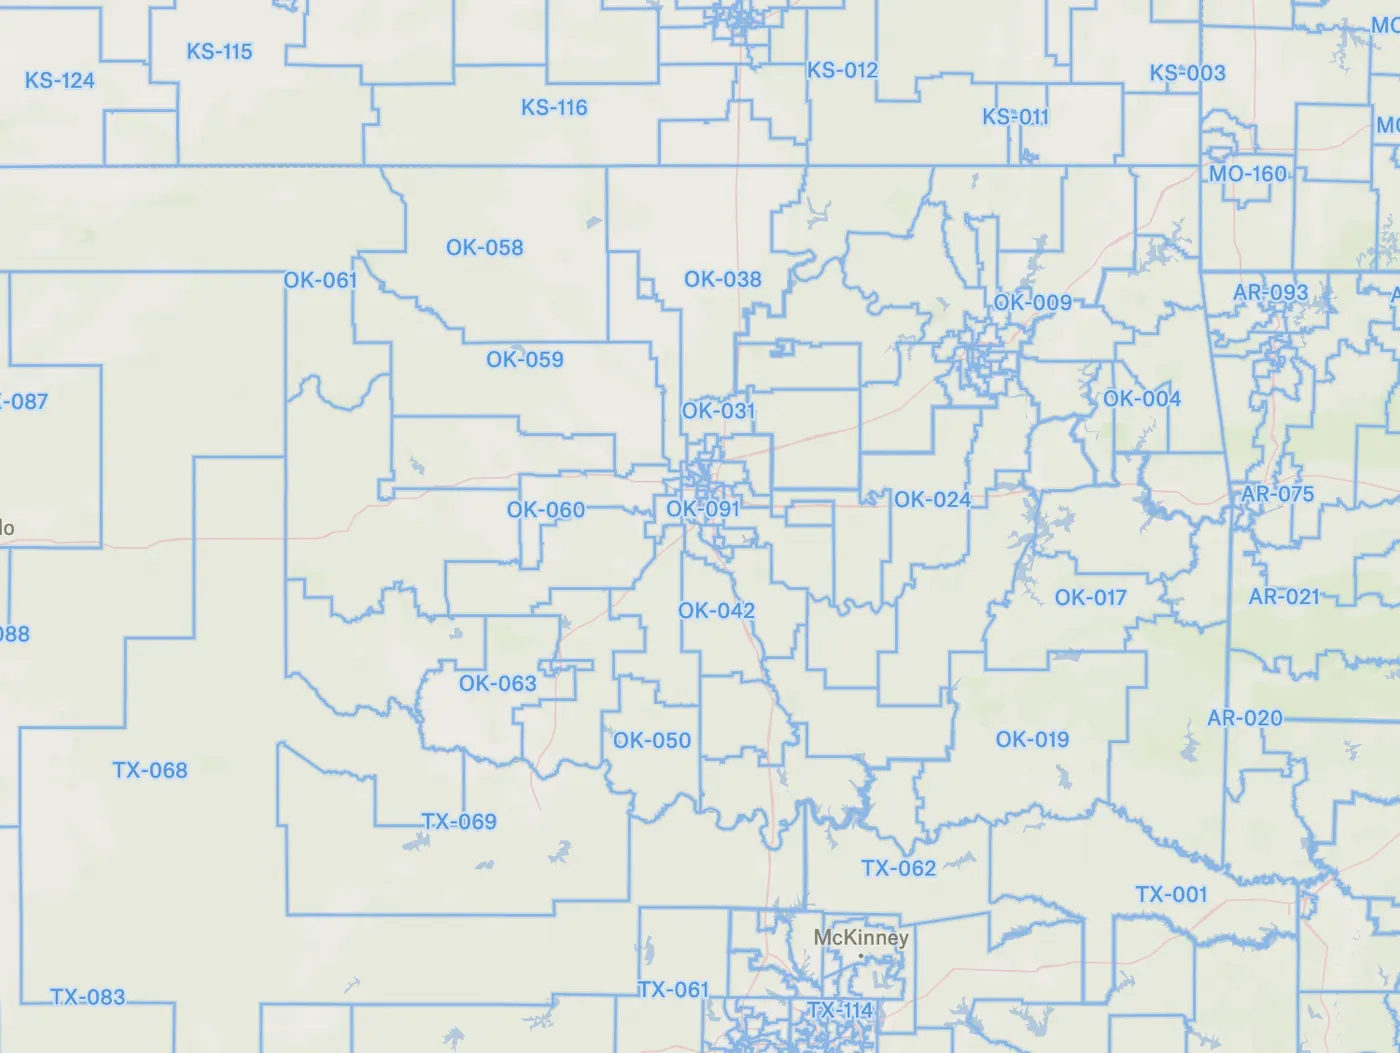
State House Districts - Check out your State House Districts. These State Legislative Districts (SLDs) are the areas in which voters elect a person to represent them in state or equivalent entity legislatures.
Libraries
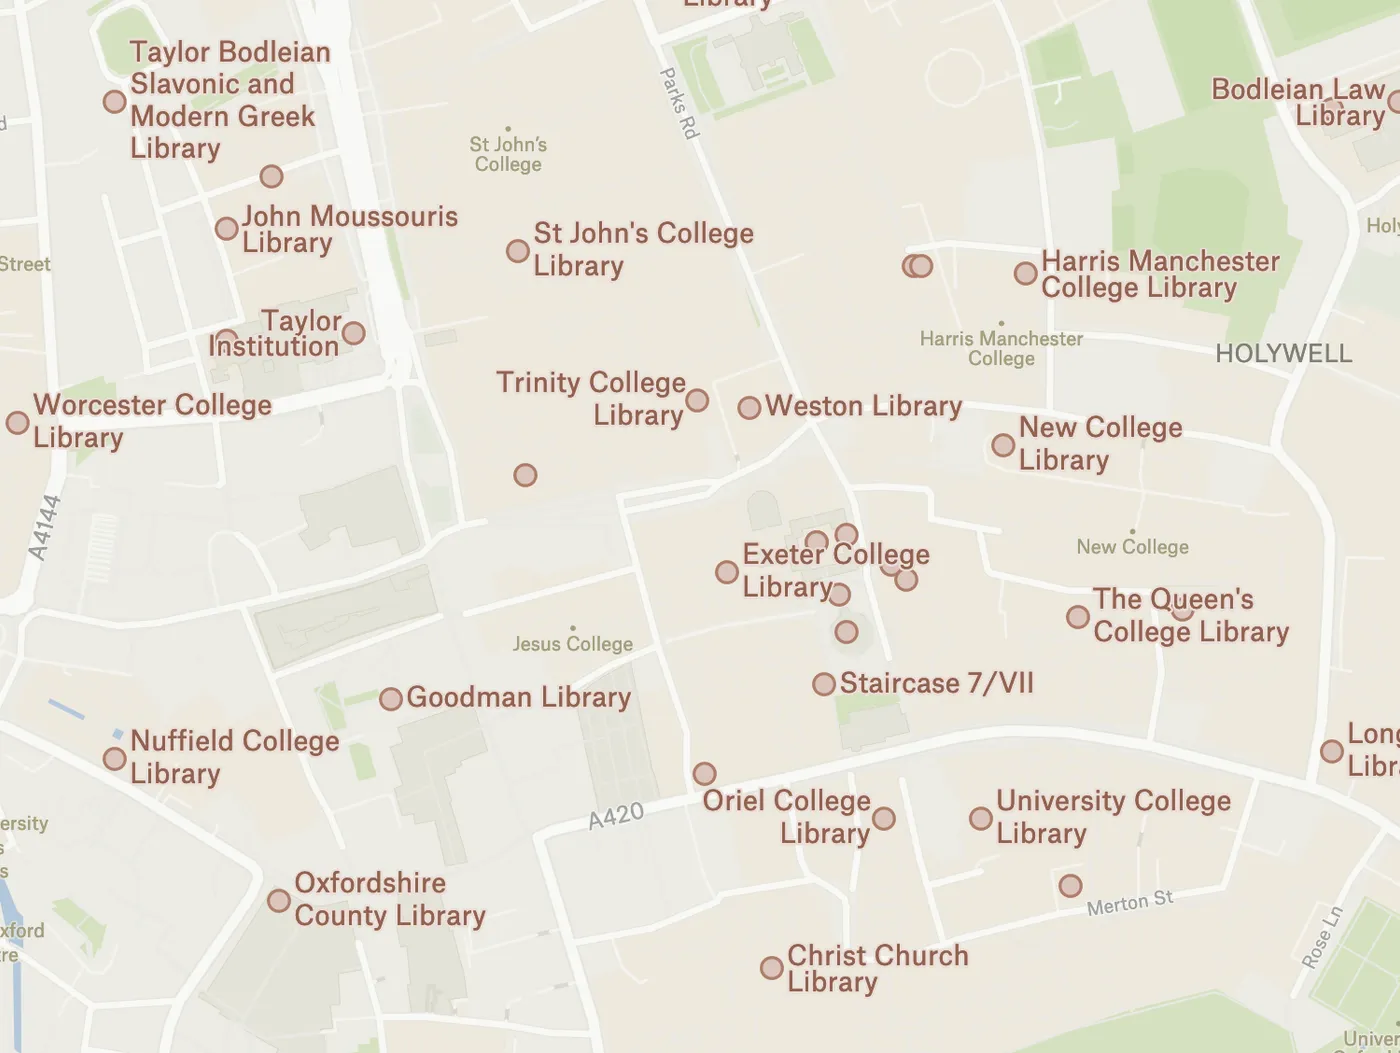
Libraries Across the Globe- Ever want to visit every library in your city? Check them off in Felt. We now have a layer with every library across the world sourced from OpenStreetMap. Duplicate the map linked above!
ZIP Codes
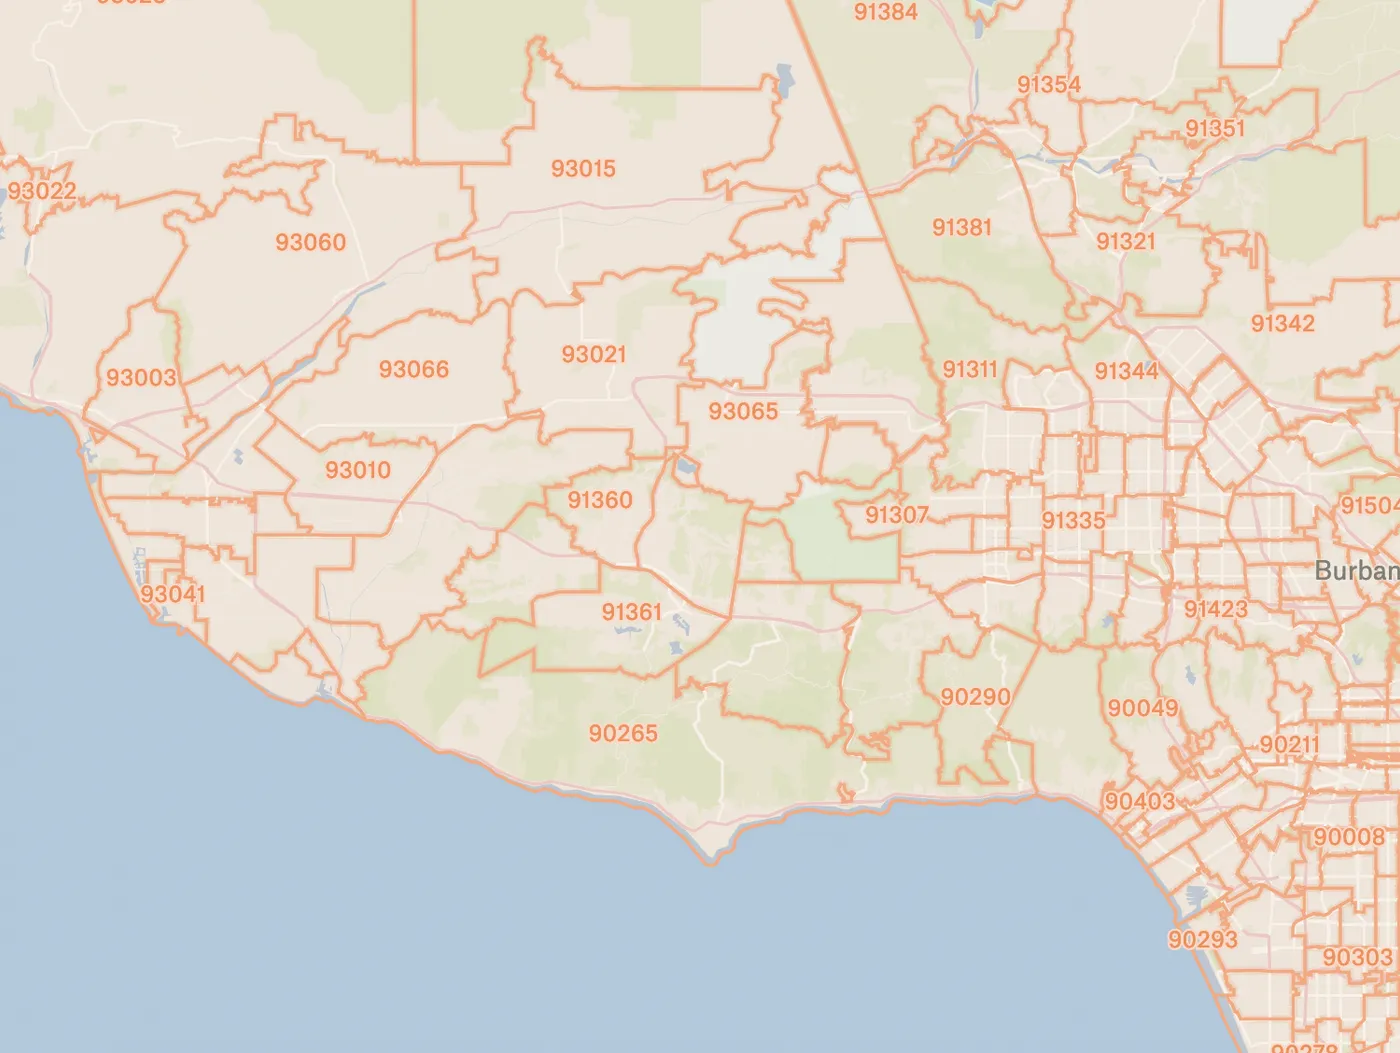
ZIP Codes- A lot of people use ZIP Codes in their workflows. If you’re one of them, you can duplicate this map and get going. ZIP Codes are tricky, and if you don’t know much about them, we recommend reading up. ZCTAs, what we show in Felt, are approximate area representations of U.S. Postal Service (USPS) 5-digit ZIP Code service areas that the Census Bureau creates using census blocks to present statistical data from censuses and surveys. The Census Bureau defines ZCTAs by allocating each block that contains addresses to a single ZIP Code tabulation area, usually to the ZCTA that reflects the most frequently occurring ZIP Code for the addresses within that block. Blocks that do not contain addresses but that are completely surrounded by a single ZIP Code tabulation area (enclaves) are assigned to the surrounding ZCTA; those surrounded by multiple ZCTAs will be added to a single ZCTA based on the longest shared border. The Census Bureau identifies ZCTAs using a 5-character code that represents the most frequently occurring USPS ZIP Code within that ZCTA. This code may contain leading zeros. Users should not use ZCTAs to identify the official USPS ZIP Code for mail delivery. The USPS makes periodic changes to ZIP Codes to support more efficient mail delivery. ZIP Codes that cover primarily nonresidential or post office box addresses may not have a corresponding ZCTA because the delineation process uses primarily residential addresses, resulting in a bias towards ZIP Codes used for city-style mail delivery.
Request a Layer
Is there a layer you want to see in Felt? Send us a data layer request for July.