Skip to content
LAT37.8044° NLON122.2711° WX-13611157 mY4551831 mE564166 mN4184363 mE6050014 ftN2120204 ftBRG041.0°041.0°040.6°042.1°ZOOM11.0CRS
← Gallery
Energy and utilities

Storm System Incident Reporter

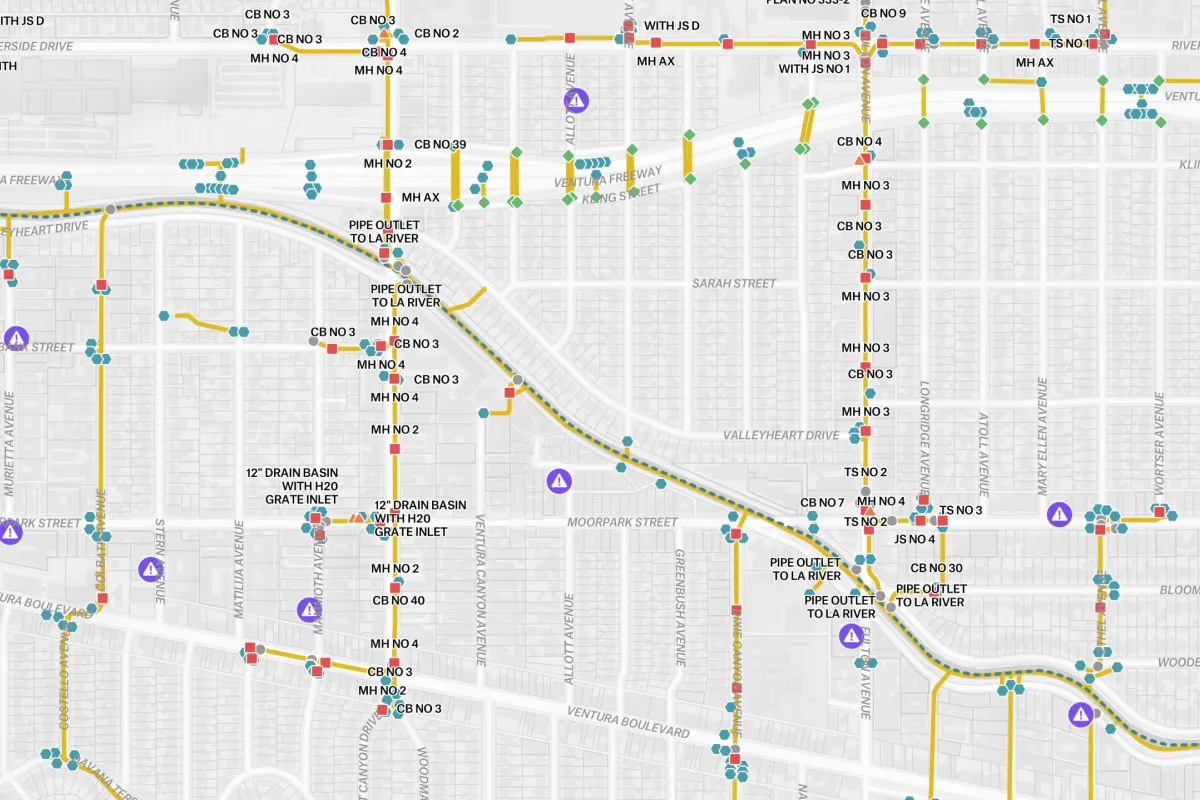
A real-time visualization of a city’s drainage infrastructure and reported issues.

Preview of Storm System Incident Reporter, an interactive Felt mapExplore this interactive map →
Storm System Incident ReporterOpen in Felt →
CartographerFeltCategoryEnergy and utilities

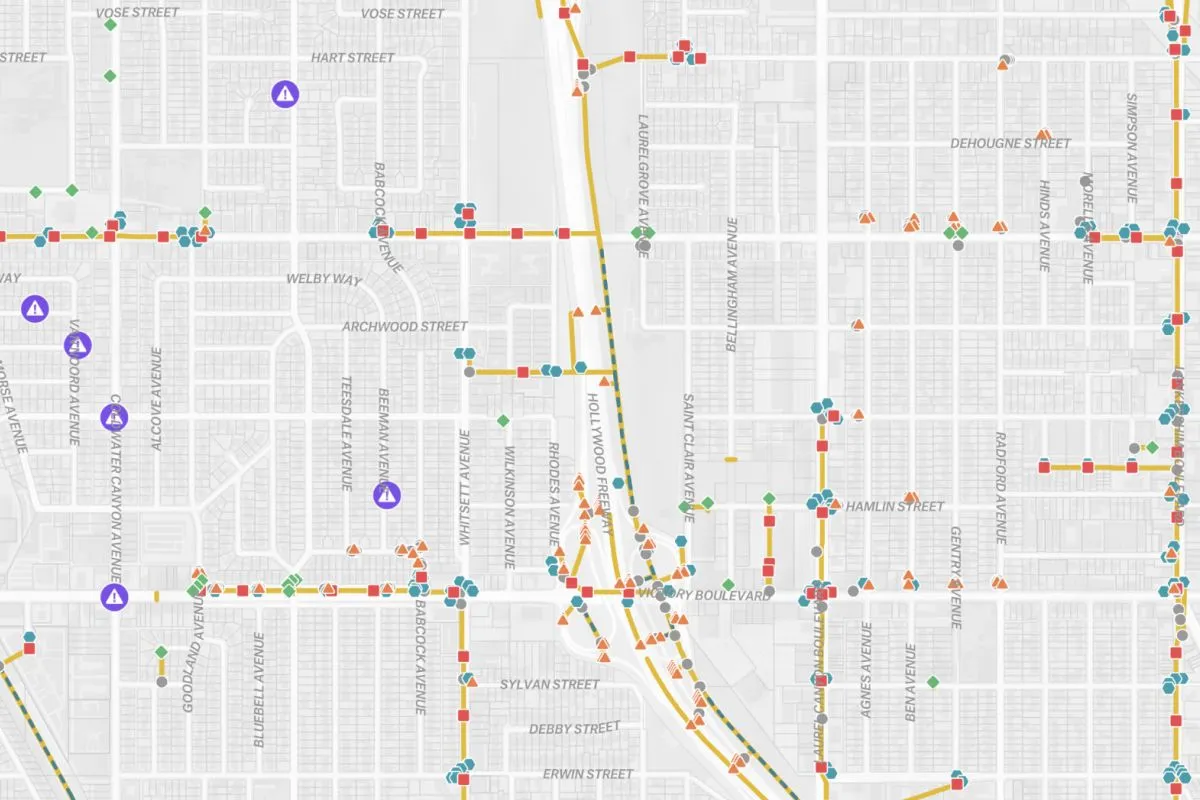
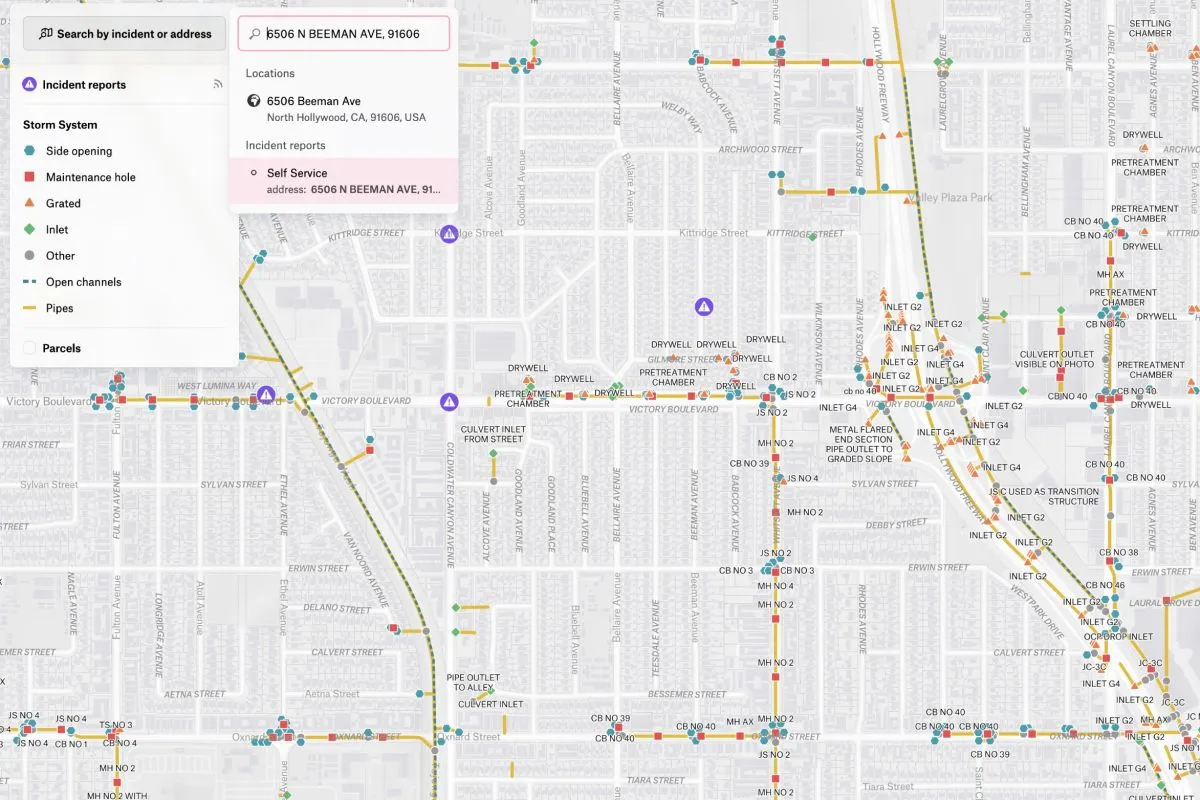
This interactive map displays storm system incidents throughout Los Angeles, providing real-time visualization of the city’s drainage infrastructure and reported issues. The intuitive interface allows users to navigate across different neighborhoods and zoom into specific locations for detailed assessment.
More views

Try Felt

Bring your data, see it on the map

Connect a database or drop in a file and see your data live on a map in minutes.