Who’s Paying the (Literal and Metaphorical) Toll: Mapping the Congestion Pricing Commute with Replica & Felt
Use the interactive map to understand just how many people drive in the Congestion Zone for work from your neighborhood
As New York debates the controversial congestion pricing plan, we collaborated with transportation and data solutions firm Replica to visualize impacts to the area.
Transportation data and solutions firm Replica collaborated with Felt to visualize Replica’s detailed data on commute patterns and explore who would be most impacted by congestion pricing in New York. Use the interactive map to understand just how many people drive into the Congestion Zone for work from your neighborhood and how that compares to commuters overall.
While the implementation of congestion pricing is on hold in New York, it’s still a widely debated topic for those in the Tri-State area. As the discussion continues, and the debate rages on just who would be most affected by the new toll, we worked with Felt to visualize some key metrics related to congestion pricing:
- Just how many people on average commute into the Central Business District (CBD) toll zone from every census tract in the area?
- What percent of total commuters in each census tract does this make up?
- For those who do commute into the Zone from each census tract, what percentage take a car and what percentage take public transit? In other words, who might be tolled and who might benefit from increased investment in public transit?
While New York may be the only city in the country currently close to implementing congestion pricing, this type of analysis can be impactful in dozens of metros across the US that are trying to analyze traffic patterns, plan sustainable public transit, and adapt to a new normal where work-from-home fundamentally changes what CBDs look like on a typical weekday.
With Replica data, it’s possible to analyze commute patterns not just by home and work location, but by industry of employment, household income, race and ethnicity, mode of transportation, and when people go to work.
Check out some of our takeaways below and explore the tool to conduct your own analysis.
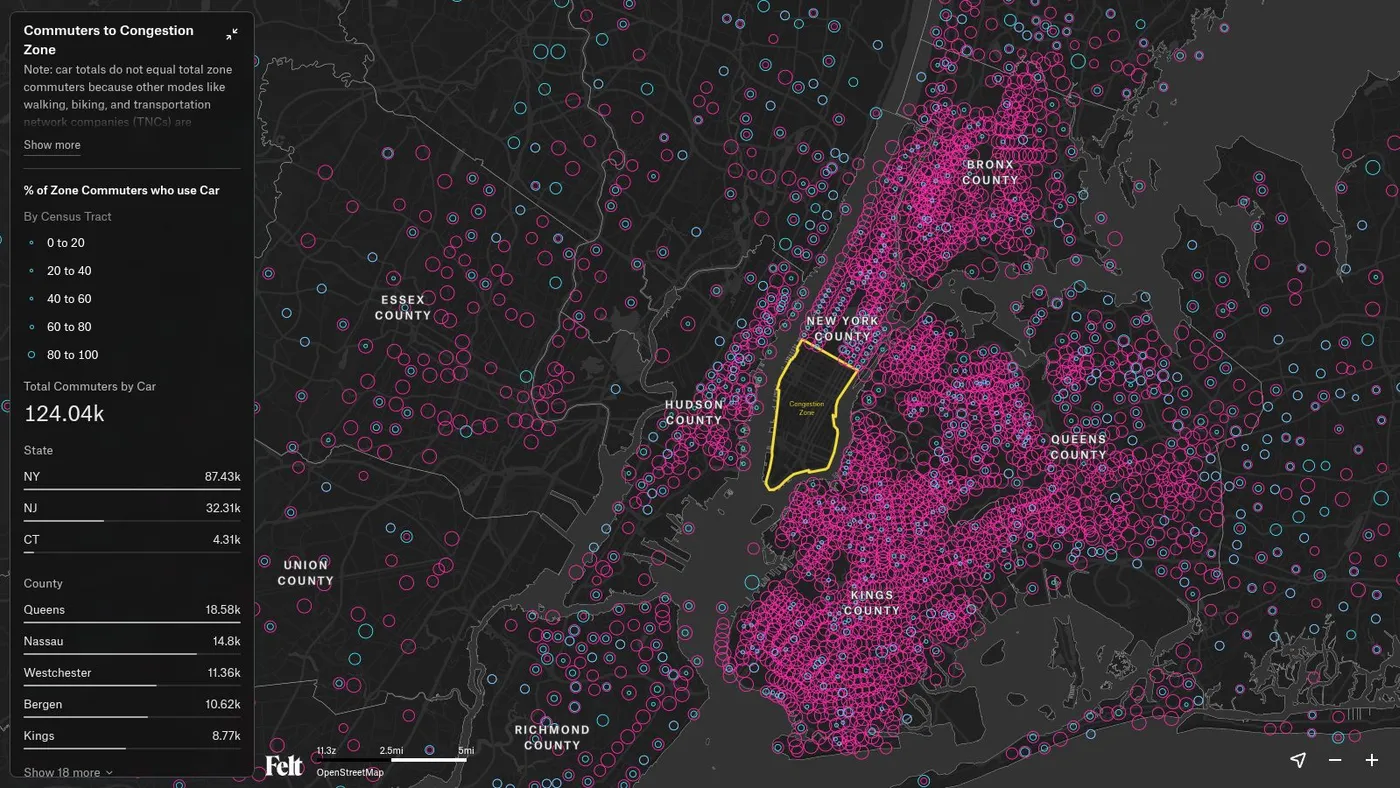
Takeaway #1: Zone commuters typically make up a far larger percentage of the workforce within the 5 boroughs than they do in suburban counties.
In many ways, this isn’t a surprise. It’s convenient to live near where you work, and for those who need to commute into Downtown Manhattan everyday, living nearby makes sense. But it also demonstrates that for most neighborhoods in the surrounding counties — Bergen, Nassau, Rockland, and Westchester — far less than 20% of commuters travel into the zone on a typical day.
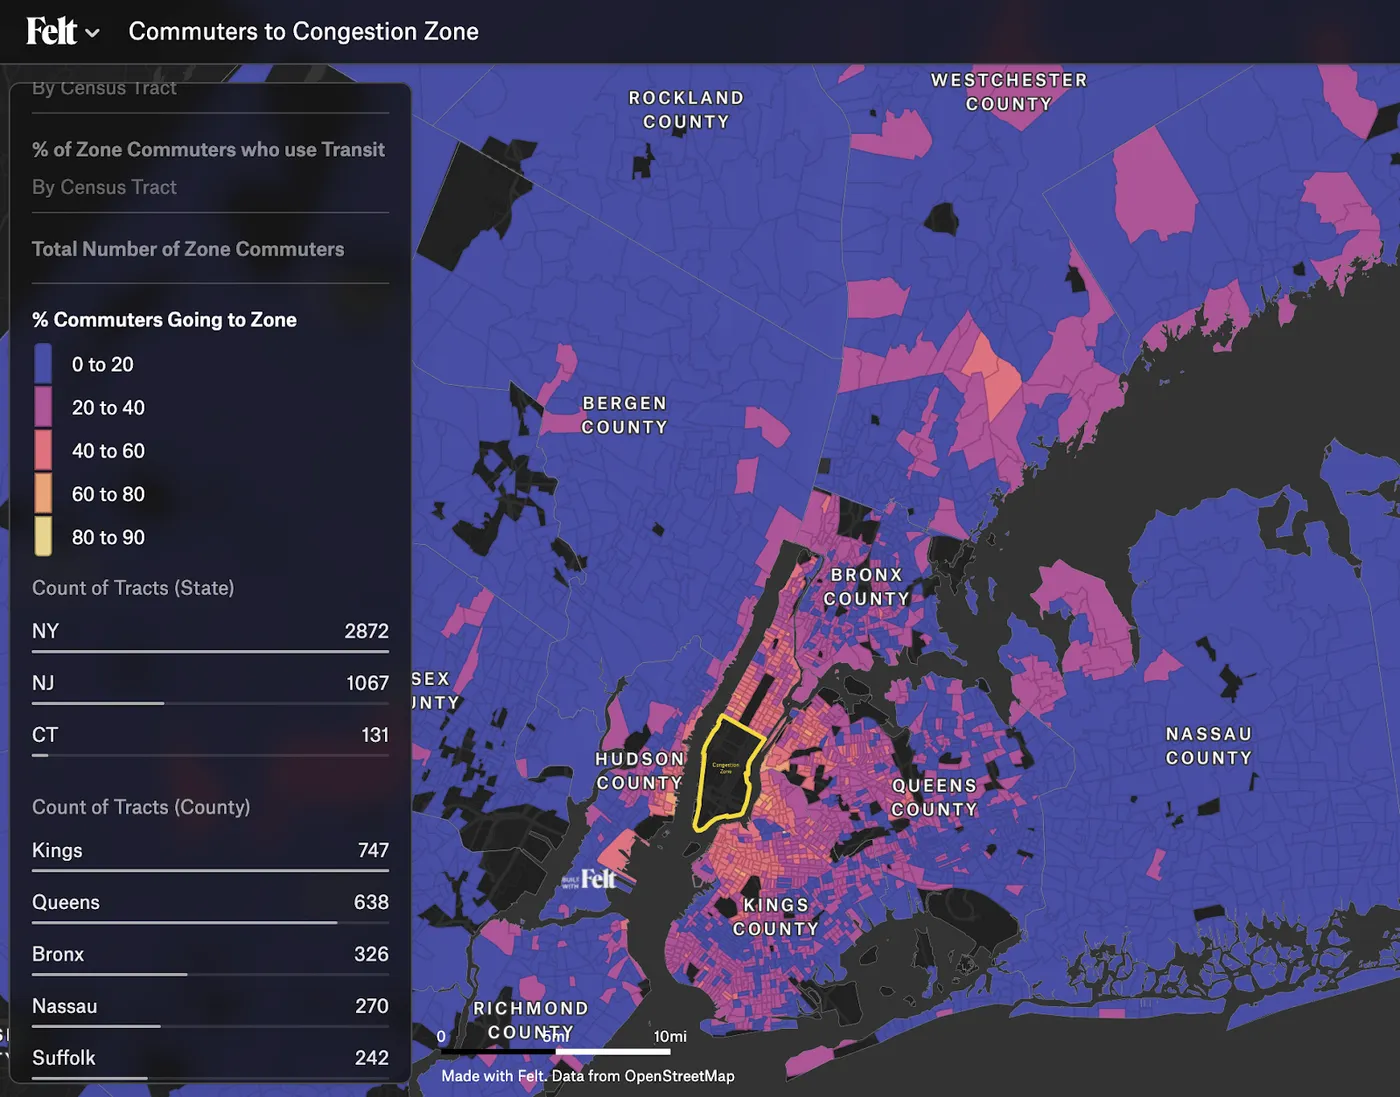
Takeaway #2: For those that do commute into the CBD, a huge majority — over 80% — take transit.
It’s not so surprising that more than 10x the amount of people take transit rather than drive into the CBD from Queens, Brooklyn and the Bronx. In Kings County, or Brooklyn, the county with the highest number of commuters to the zone, just 4 census tracts out of 751, or about 0.05%, have more car commuters to the zone than transit commuters.
But it’s not just true for the 5 boroughs. That pattern holds in less urban areas. In Nassau and Bergen counties, 35% more people take transit than drive. From Westchester, it’s 80% more, and from Essex and Hudson County right across the river, it’s 170% and 376% more, respectively.
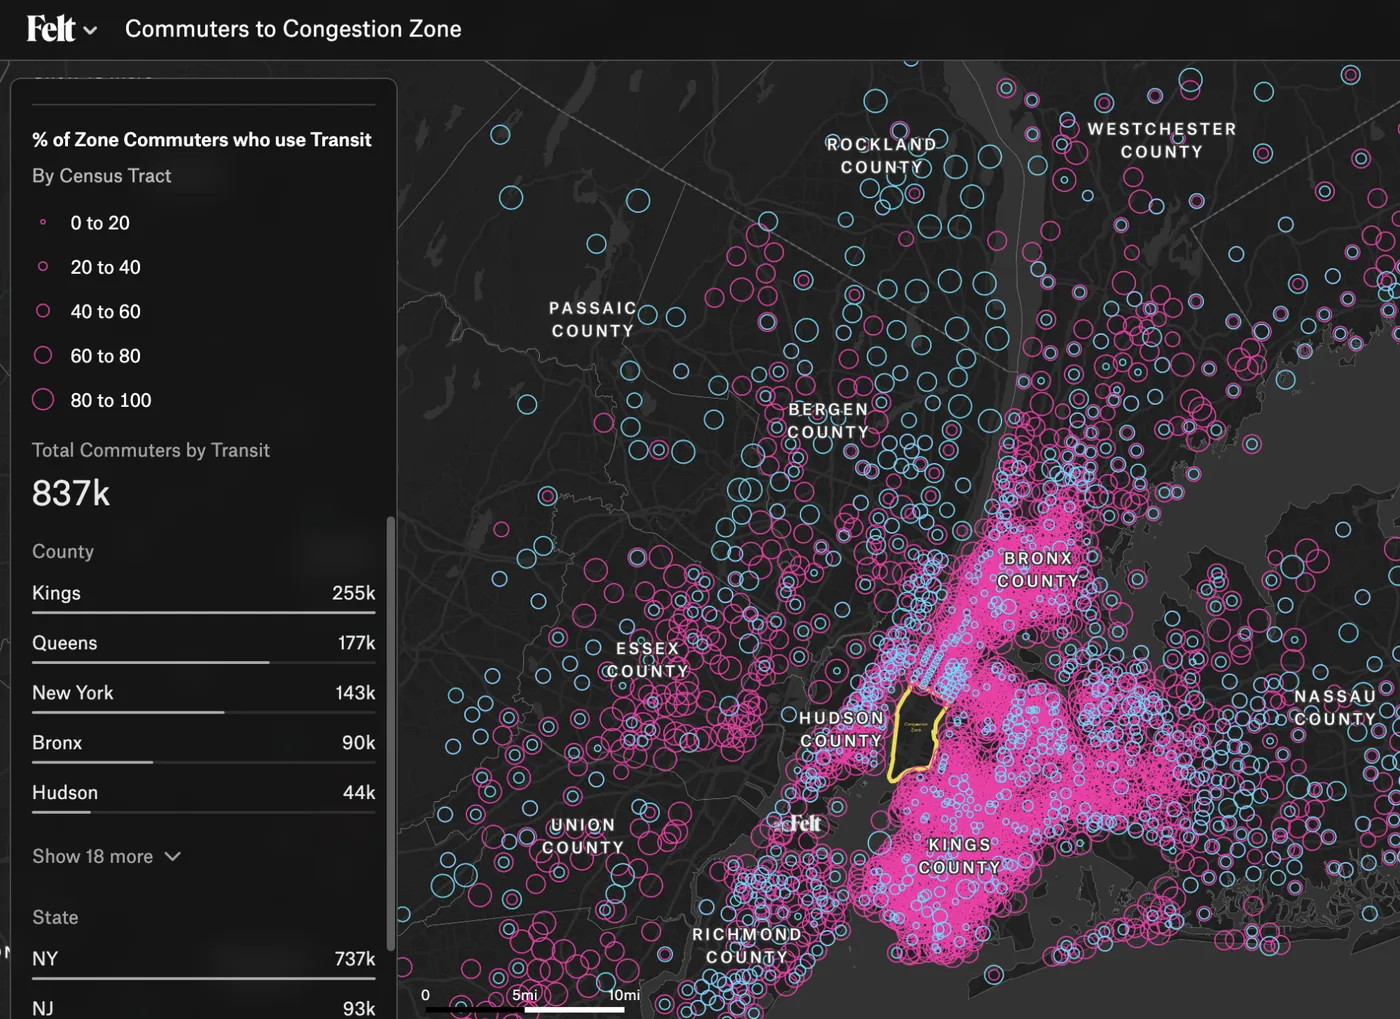
Takeaway #3: On average, those who commute by car into the Congestion Zone are wealthier and less diverse than those who take transit.
Compared to those who take transit, those who drive into the zone have an average household income 11% higher ($189K vs. $171K) and median income 15% higher ($136K vs. $114K). Editor’s Note: This article is a collaboration between Felt and Replica, and can be found cross-posted on both our blogs. Felt makes complex spatial analysis easy with it’s cloud-native GIS platform. With our new database connectors and dashboarding tools, solving your geospatial needs takes far less time than with traditional GIS tools. Interested? Reach out to our sales team.