Exploring the power of Felt’s API: highlights from our internal Hackathon
Whether it’s real-time data integration, interactive gaming, or advanced geospatial analysis, the possibilities are endl

Whether it’s real-time data integration, interactive gaming, or advanced geospatial analysis, the possibilities are endless with Felt’s API.
Two weeks ago, we launched the Felt API, and we’ve already seen over 15,000 calls. To explore its capabilities, we hosted an internal hackathon, and the results were spectacular.
Here are three standout projects that demonstrate the diverse potential of Felt’s API.
Live Weather Map
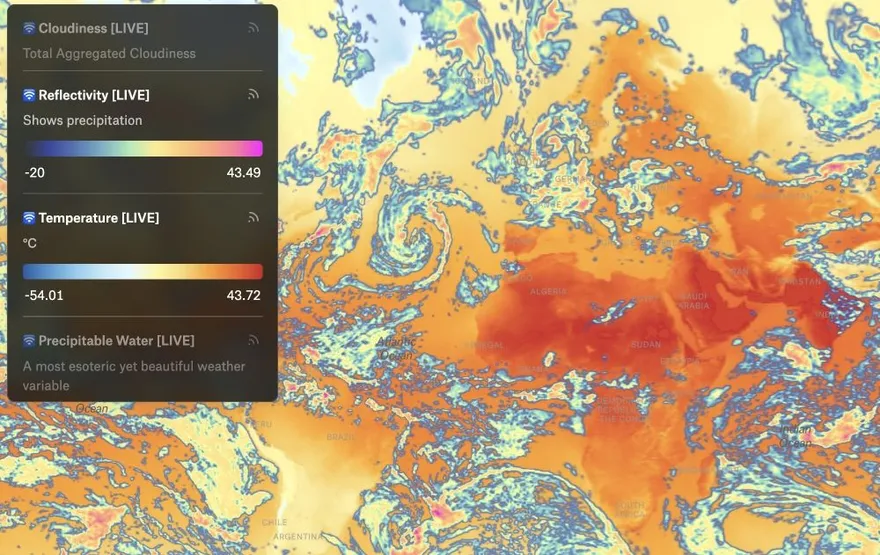
Kyle and Damon developed a live weather map that integrates hourly data from the NOAA NOMADS API. The map features four interactive layers: cloudiness, reflectivity, temperature, and precipitable water. Using Felt’s live data refresh feature, this map provides real-time updates, making it a powerful tool for weather monitoring and forecasting.
Interactive 1983 Global Thermonuclear War Game
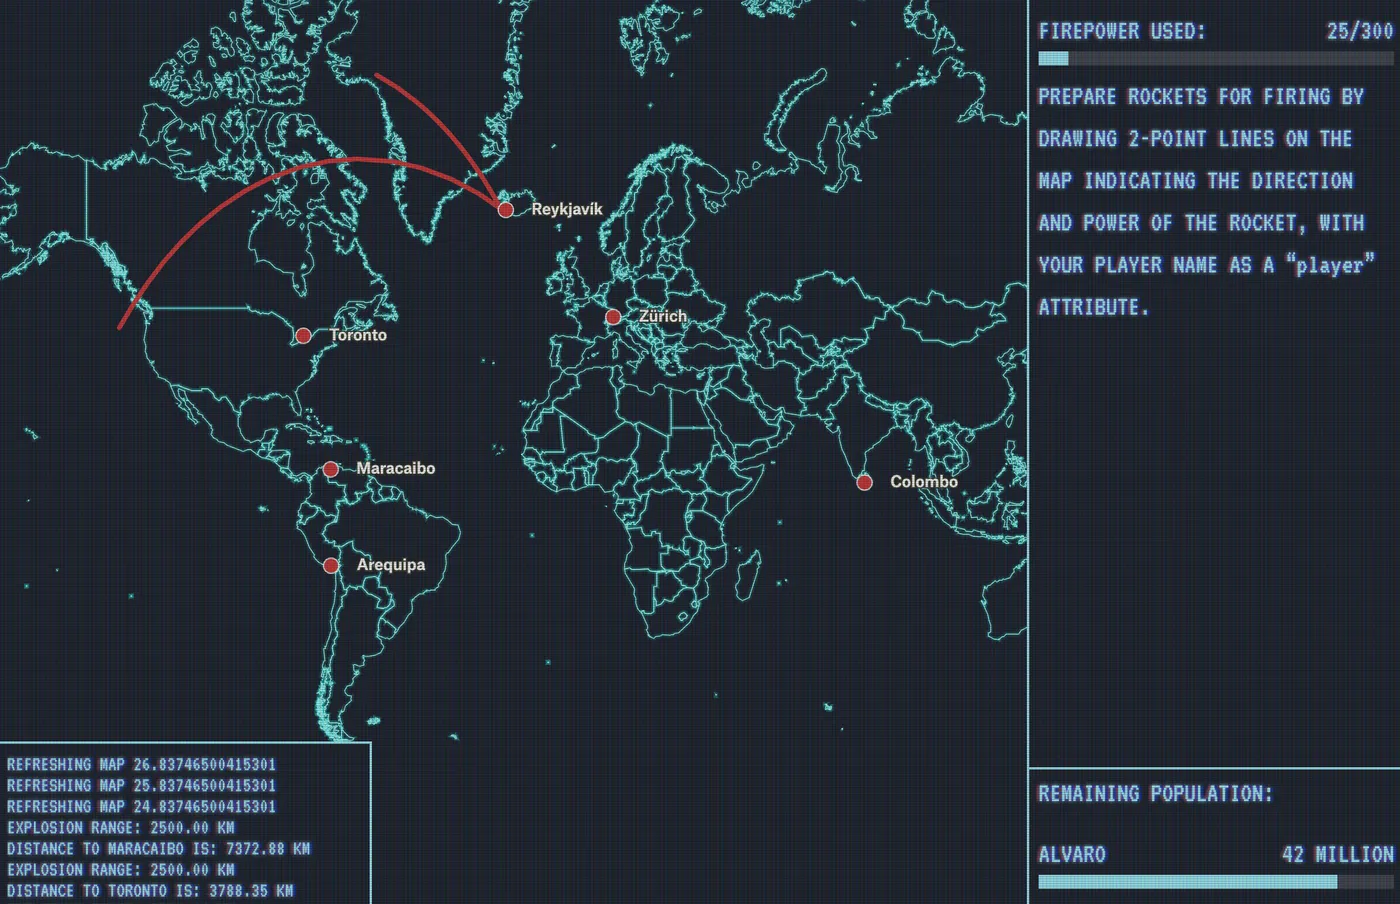
Tom and Isaac brought a classic game to life with a map-based version of the 1983 Global Thermonuclear War game. Leveraging the API’s new element creation and webhook features, they created an engaging, interactive experience where users can simulate strategies on a global scale. This project showcases how Felt’s API can be used to build complex, interactive applications.
Elevation Profile Generator by Chris
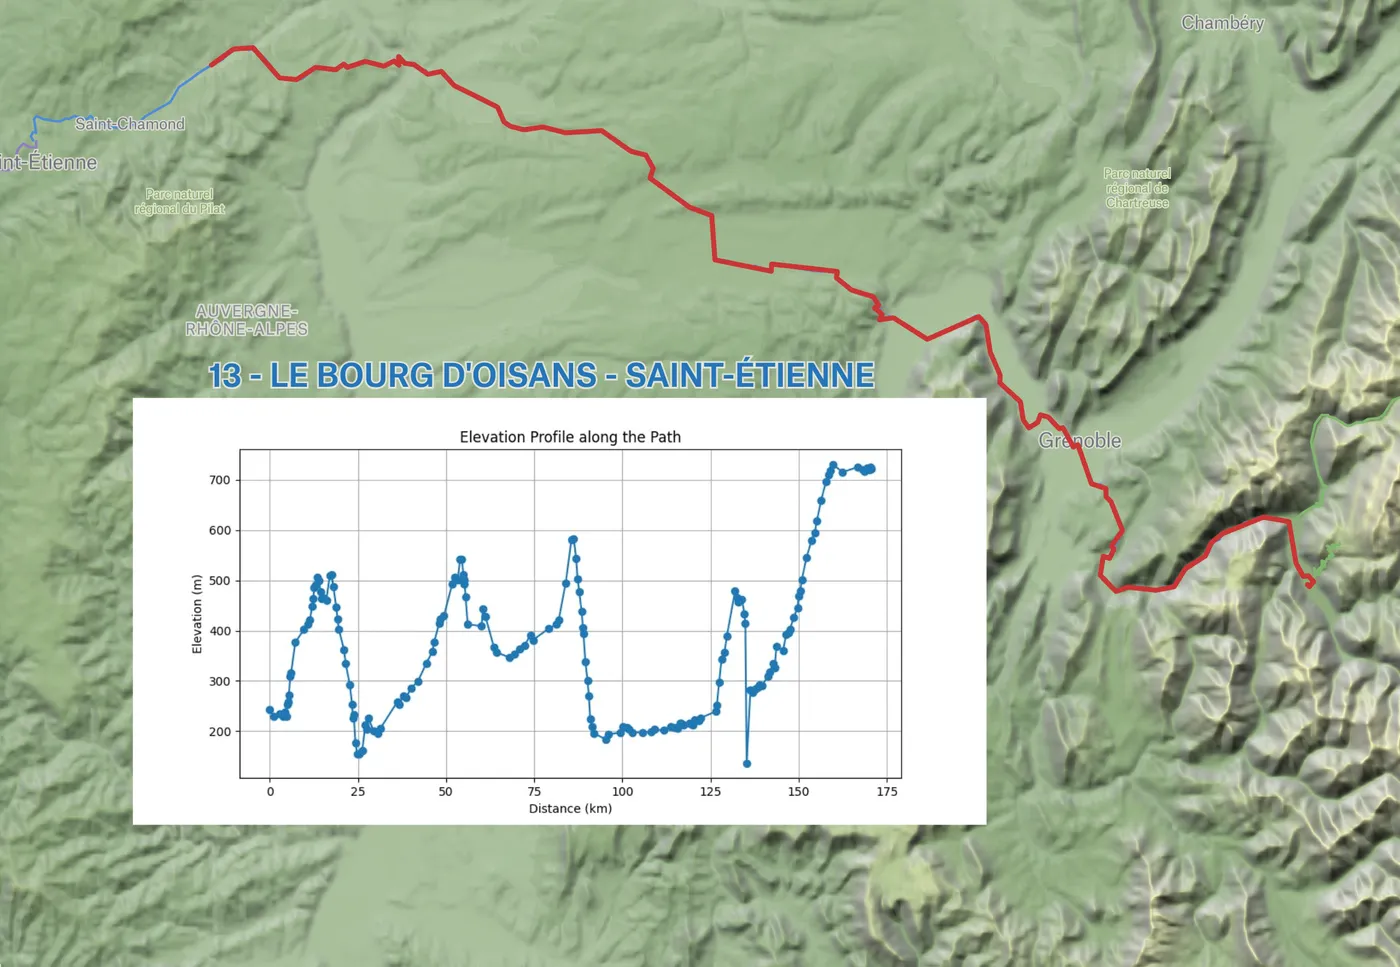
Chris created an elevation profile generator that enhances route planning on Felt maps. This tool uses the element creation and webhook features to detect newly created routes, query an elevation service, generate an elevation profile image, and post it next to the route on the map.
In this map, he’s using it to plot elevation profiles of stages of the Tour de France, but can be used by anyone needing detailed elevation data for their routes, from hikers to urban planners.
Try it out
These projects not only highlight the flexibility and power of Felt’s API but also inspire future innovations. Whether it’s real-time data integration, interactive gaming, or advanced geospatial analysis, the possibilities are endless with Felt.
Get started today by creating an API token.